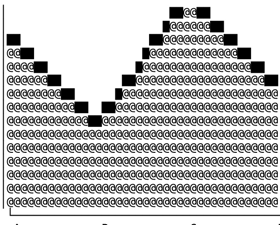
ASCII Graphs - CSV to Graph Converter
A web app that turns raw CSV data into polished ASCII-style graphs in one click. Built for creators—zero learning curve, beautiful default designs, and fast exports for blogs, Notion, Medium, and more.
Video Preview
ASCII Graphs Demo
About
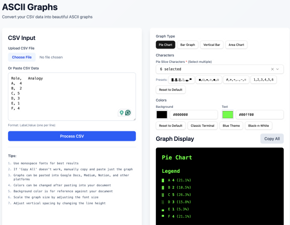
ASCII Graphs is a CSV-to-graph converter built for creators. Upload or paste CSV data, choose a graph type (pie, bar, vertical bar, area), and copy a polished graph into your blog, Notion, Medium, or Google Docs. It’s designed for zero learning curve, good-looking defaults, and quick exports so you can focus on writing.
You can try it at ascii-graphs.vercel.app, see it on Product Hunt, or browse the code on GitHub.

Features
- CSV in, graph out: Paste or upload CSV (Label,Value), pick a graph type, and get a shareable ASCII-style chart.
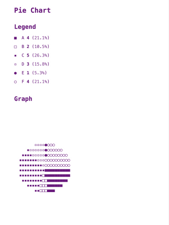
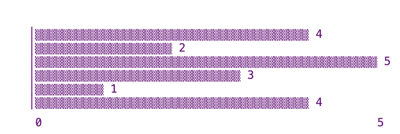
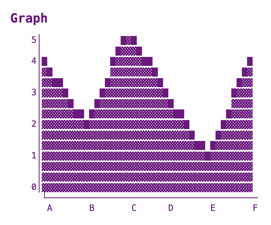
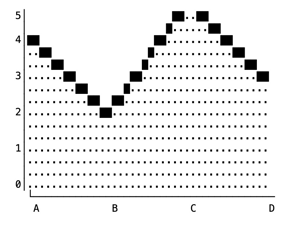
- Multiple chart types: Pie, bar, vertical bar, and area charts with customizable characters and colors.
- Creator-friendly: Monospace-friendly output, copy-paste into docs, and tips for scaling and line height.
- Presets and theming: Classic terminal, blue, and black-and-white presets; custom background and text colors.
Tech Stack
- Next.js – App router, server and client components.
- TypeScript – Typed logic for parsing CSV and building charts.
- Tailwind CSS – Layout and theming.
- ShadCN UI – UI for inputs, preview, and export.
In the wild
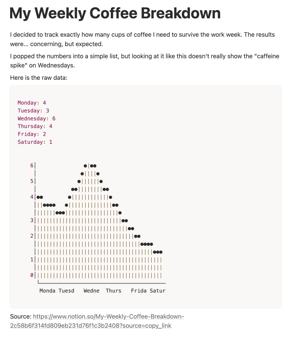
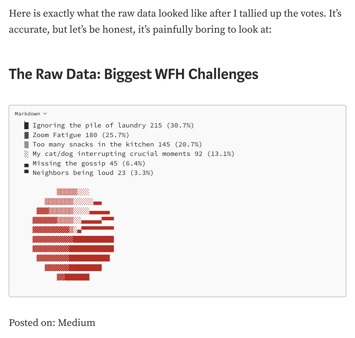
Graphs generated by ASCII Graphs can be dropped into Notion, Medium, and similar editors. Below: how they look when pasted into Notion and on a Medium blog.
Links
- Live app: ascii-graphs.vercel.app
- Product Hunt: ASCII Graphs on Product Hunt
- Source: github.com/HarshnaNHaswani/ascii-graphs